

On this page 20 sections
- Why Your Break-Even Point Is a Game-Changer
- Understanding the Core Components
- Gathering Your Key Financial Ingredients
- Unpacking Your Fixed Costs
- Identifying Your Variable Costs
- Fixed vs Variable Costs in a Restaurant
- Calculating Your Break-Even Point in Units Sold
- Meet Chef Anna and Her Signature Burger
- Putting the Formula Into Action
- Finding Your Break Even Point in Sales Dollars
- The Contribution Margin Ratio Explained
- A Multi-Product Example in Action
- Putting Your Break-Even Analysis into Action
- Driving Profitability with Smart Adjustments
- A Special Case for Hotels: The Break-Even Occupancy Rate
- Common Questions About Break Even Analysis
- How Often Should I Calculate My Break Even Point?
- What Is a Good Contribution Margin for a Restaurant?
- How Can I Lower My Break Even Point?
- How Do I Calculate Break Even with Multiple Products?
At its core, calculating your break-even point is surprisingly simple: divide your fixed costs by your contribution margin. That’s it.
This single number transforms a mountain of financial data into a clear, actionable target for your restaurant, bar, or hotel. It tells you the exact sales volume you need to hit just to cover your expenses.
Why Your Break-Even Point Is a Game-Changer
Staring at a profit and loss statement can feel like reading a foreign language. You see revenue coming in and expenses going out, but what’s the magic number that separates a stressful, in-the-red month from a profitable one?
That number is your break-even point. Think of it as your operational North Star.
Imagine you run a spot with high rent in a prime downtown location, and your food costs are all over the place. One month, produce is cheap; the next, an unexpected spike blows up your budget. Without a clear financial target, every pricing or staffing decision feels like a shot in the dark.
The break-even point cuts right through that uncertainty. It gives you a concrete goal to aim for.
Understanding the Core Components
Figuring this out is less about complex math and more about getting a firm grip on the three key ingredients that drive your business financially. Once you understand these, the whole process clicks into place.
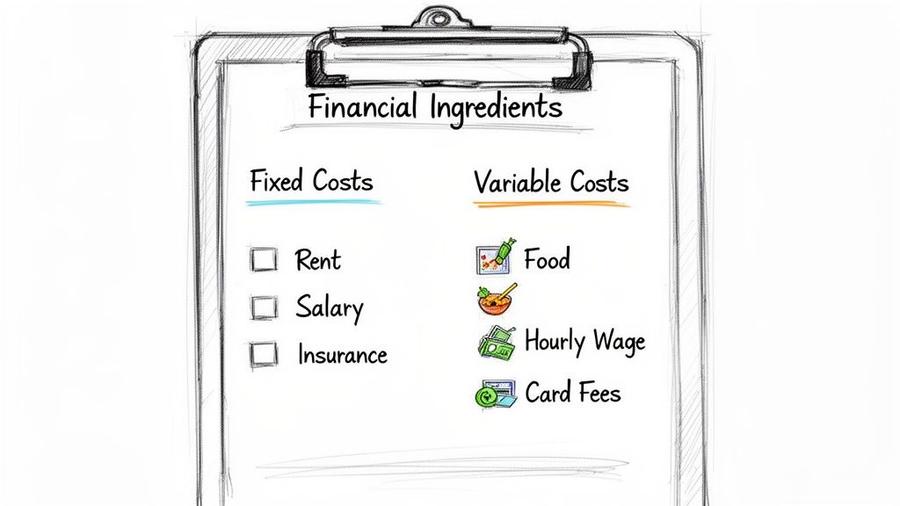
- Fixed Costs: These are the bills you have to pay no matter how many guests walk through the door. Think monthly rent, manager salaries, insurance premiums, and your POS system subscription. They’re predictable.
- Variable Costs: These expenses move up and down directly with your sales volume. This bucket includes your food and beverage inventory, hourly staff wages, and credit card processing fees. The busier you are, the higher these costs climb.
- Contribution Margin: This is the real engine of your profitability. It’s the cash you make on an individual sale after subtracting its variable costs. It’s what’s left over to “contribute” to paying off your fixed costs and, eventually, turning a profit.
Knowing exactly where your revenue equals your expenses allows you to set realistic sales goals, make smarter pricing decisions, and manage costs with confidence. You stop reacting to financial pressures and start proactively steering your business toward profitability.
There are two main ways to look at your break-even point. You can calculate it by the number of units you need to sell (e.g., how many burgers or cocktails) or by the total sales revenue you need to bring in.
Both methods give you critical insights, turning abstract financial data into tangible targets your entire team can rally behind.
Gathering Your Key Financial Ingredients
Before you can crunch any numbers, you have to get your financial house in order. This is the part where many operators get tripped up, but getting this right makes everything else fall into place. Think of it less like painful accounting and more like prepping your station before service; accuracy now prevents chaos later.
Your Profit & Loss (P&L) statement is where the story begins. It holds all the numbers you need. The trick is knowing how to sort them into the right buckets: what you pay no matter what, and what you only pay when you make a sale.
Unpacking Your Fixed Costs
First up are your fixed costs. These are the bills that show up every month like clockwork, whether you served one guest or a thousand. They are the financial bedrock of your operation, the cost of keeping the lights on and the doors open.
When you're first getting started, understanding your restaurant startup costs is critical, as many of those initial investments translate directly into these ongoing fixed payments.
Common examples you'll see on your P&L include:
- Rent or Mortgage: Your monthly payment for the physical space.
- Salaries: The predictable pay for your managers, head chef, and any admin staff.
- Insurance: Liability, property, and workers' comp—the non-negotiables.
- Software Subscriptions: Your monthly fees for the POS, reservation platform, or accounting tools.
- Loan Payments: Any repayments on business loans you've taken out.
These numbers are generally stable month-to-month, making them the easiest part of the equation to nail down. If you want to go deeper on this, our guide on how to calculate your overhead rate is a great next step.
Identifying Your Variable Costs
Next, you need to isolate your variable costs. These are the expenses that move in lockstep with your sales. The busier you are, the higher they climb. For every burger you sell or cocktail you pour, there's a direct cost that comes right along with it.
These are the costs tied directly to production and service:
- Food & Beverage (COGS): The ingredients that go into every single dish and drink.
- Hourly Labor: The wages for your servers, line cooks, and bartenders, which scale up with more shifts.
- Credit Card Fees: The small percentage skimmed off every single transaction.
- Packaging: Takeout containers, napkins, and other disposables that go out the door with each order.
Sorting your expenses into these two camps—fixed and variable—is the most important step. It gives you a crystal-clear picture of your restaurant's financial DNA, which is the foundation for an accurate break-even calculation.
Fixed vs Variable Costs in a Restaurant
This table should help clarify the buckets, but some costs can be tricky. Utilities, for instance, often have a fixed base rate plus a usage component, making them semi-variable. For your first break-even analysis, do not get bogged down. Just look at your last few bills, find a reasonable monthly average, and treat it as a fixed cost. The goal here is clarity, not perfection. Just be consistent.
Calculating Your Break-Even Point in Units Sold
Now that your costs are sorted, it's time to put them to work. The first way to calculate your break-even point is by units sold. This approach gives you a tangible, specific target: exactly how many of a single product you need to sell to cover all your costs.
This is a game-changer for businesses with a signature item—a popular burger, a best-selling cocktail, or a specific room type. It turns an abstract financial goal into a concrete daily or weekly target your entire team can understand and rally behind.
The formula itself is refreshingly simple.
Break-Even Point (in units) = Total Fixed Costs / (Selling Price Per Unit – Variable Cost Per Unit)
That bottom part of the equation, (Selling Price Per Unit – Variable Cost Per Unit), is your contribution margin per unit. This single number is incredibly important. It represents the dollar amount each sale "contributes" toward paying off your fixed costs.
Meet Chef Anna and Her Signature Burger
Let's make this real. Imagine Chef Anna, who runs a popular neighborhood bistro. Her signature "Bistro Burger" is a consistent top seller, and she wants to know exactly how many she needs to sell each month just to break even.
First, Anna pulls her monthly fixed costs from her P&L statement. Her rent, salaries, insurance, and software subscriptions add up to $22,000.
Next, she calculates the variable cost for a single Bistro Burger. She meticulously adds up the cost of the brioche bun, the premium ground beef, artisanal cheese, and a side of fries. Factoring in direct labor and packaging, her variable cost per burger comes out to $6. You can get a much deeper look into this process by reading our guide on how to calculate prime cost.
Finally, she knows the Bistro Burger sells for $18.
With these three numbers, she can plug them right into the formula:
- Fixed Costs: $22,000
- Selling Price: $18
- Variable Cost: $6
Her contribution margin per burger is $12 ($18 - $6). This means every single time a customer buys a Bistro Burger, it generates $12 that goes directly toward chipping away at that $22,000 in fixed costs.
Putting the Formula Into Action
Now for the final calculation:
$22,000 (Fixed Costs) / $12 (Contribution Margin) = 1,834 burgers
Chef Anna has her magic number. She needs to sell 1,834 Bistro Burgers every month just to cover her expenses. Anything beyond that is pure profit.
This breaks down to about 61 burgers per day, giving her kitchen a clear, measurable goal that directly connects their daily work to the restaurant's financial health.
For many operators, seeing this calculation laid out is a genuine "aha" moment. It transforms the overwhelming idea of "profitability" into a simple, actionable sales target. This straightforward math provides a clear path from costs to profit, one unit at a time.
Finding Your Break Even Point in Sales Dollars
Calculating your break-even point by the burger works perfectly when you’re focused on a single, star menu item. But what about when your business is a bustling café with dozens of different coffees, pastries, and sandwiches?
Counting individual units becomes a nightmare, fast.
This is where calculating your break-even point in sales dollars gives you a much clearer, more practical picture. It answers a better question: What's the total revenue we need to hit just to cover our costs? For any business with a diverse menu, this is the way to go.
To do this, the formula shifts slightly. We stop looking at the contribution margin per unit and instead focus on the contribution margin ratio.
The Contribution Margin Ratio Explained
The contribution margin ratio is a powerful little metric. It tells you what percentage of every single sales dollar is left over to cover your fixed costs and, eventually, generate profit. It’s so useful because it automatically accounts for your entire sales mix, not just one item.
You can find it with a simple calculation:
Contribution Margin Ratio = (Total Sales – Total Variable Costs) / Total Sales
Let's say your café brings in $50,000 in monthly sales. Your total variable costs—things like ingredients, hourly labor, and packaging—come out to $20,000. Your contribution margin is $30,000.
Your ratio would be 60% ($30,000 / $50,000). This means for every dollar you earn, 60 cents is left to pay your rent, salaries, and other fixed expenses.
Once you have that ratio, you can calculate your break-even point in sales dollars with another straightforward formula:
Break-Even Point (in Sales Dollars) = Total Fixed Costs / Contribution Margin Ratio
This simple visual breaks down the core logic.
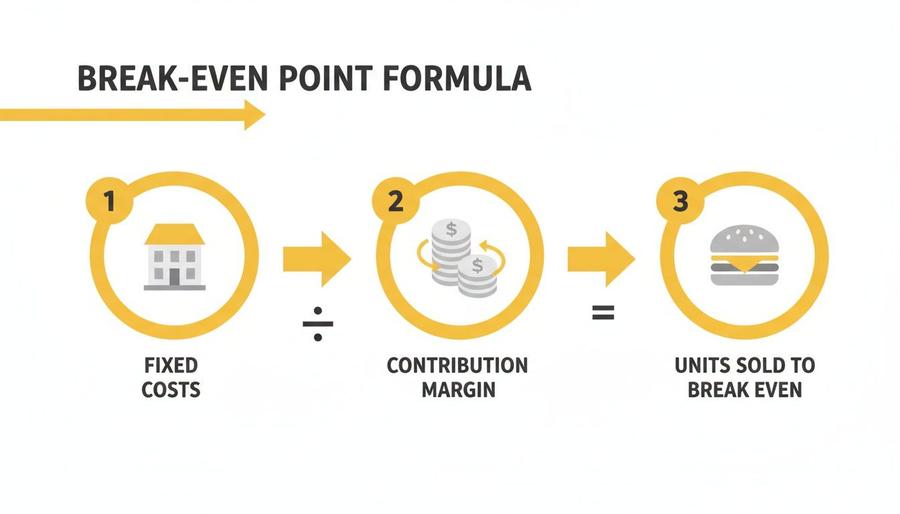
It shows how your fixed costs are chipped away by the contribution margin from each sale until you finally hit that zero-profit, zero-loss point.
A Multi-Product Example in Action
Let's go back to our café owner. We know their monthly fixed costs for rent, salaries, and utilities are $18,000. We also just figured out their contribution margin ratio is 60% (or 0.60).
Now, we just plug those numbers into the formula:
$18,000 (Fixed Costs) / 0.60 (Contribution Margin Ratio) = $30,000
The café needs to generate $30,000 in total sales each month just to break even.
This single, top-line revenue target is far more useful for financial planning than trying to track thousands of individual muffins and lattes. It gives your management team a clear, high-level goal to rally around. For multi-unit groups looking to scale, this is a metric top operators often track weekly to make quick adjustments.
If you want to get a tighter grip on your expenses, our guide on how to calculate labor cost percentage is a great place to start.
Putting Your Break-Even Analysis into Action
Figuring out your break-even number is a great start. The real magic happens when you use that number to make smarter, more profitable decisions every single day.
This is not just an accounting exercise; it's a practical tool for steering the ship. Your analysis can inform everything from menu pricing to your next marketing push, turning raw data into real-world strategy.
Once you know your target, you can start pulling different levers to get into the black faster. This is where you shift from just calculating your break-even point to actively managing it.
Driving Profitability with Smart Adjustments
Your break-even point is not set in stone. By making strategic changes in your operations, you can lower the number of sales you need to make to turn a profit. This proactive approach is what separates the good operators from the great ones.
Here are a few ways to put your analysis to work right now:
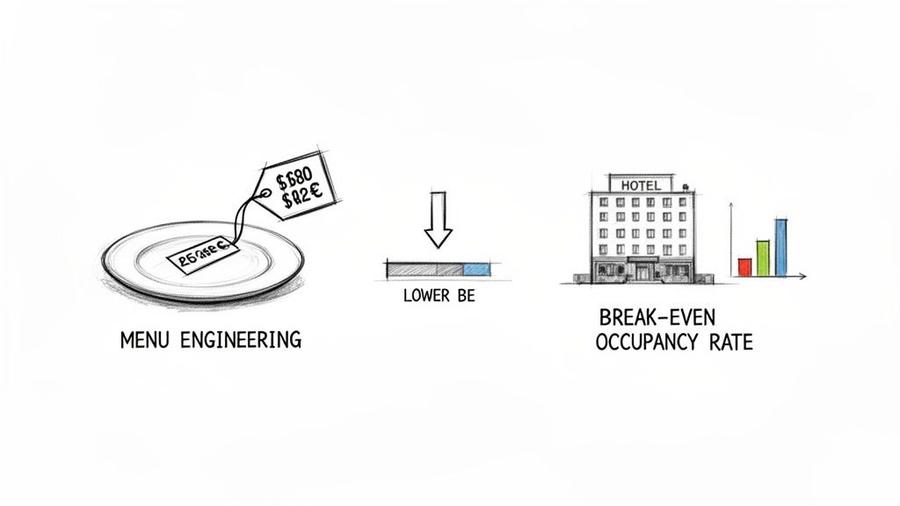
- Menu Engineering: Pinpoint your high-contribution-margin items—your true profit drivers—and feature them more prominently. On the flip side, you could slightly increase the price on popular, low-margin items or tweak their ingredients to bring down their variable costs.
- Staffing Optimization: Your break-even analysis gives you a clear line in the sand for labor costs. If sales dip, you have a solid financial reason to adjust schedules, preventing unnecessary labor expenses from eating your profits alive.
- Evaluating Promotions: Thinking about a "2-for-1 burger night"? Use your break-even calculation to determine exactly how many more burgers you need to sell to make the promotion worth it. This stops you from flying blind and helps you calculate the true ROI of any marketing push.
Your break-even analysis transforms from a static number into a dynamic guide for decision-making. It gives you the confidence to adjust pricing, manage costs, and invest in growth with a clear understanding of the financial impact.
A Special Case for Hotels: The Break-Even Occupancy Rate
For hoteliers, the game is not about selling more burgers; it's about filling more rooms. The key metric here is the Break-Even Occupancy Rate (BEOR), which tells you the percentage of rooms you need to sell just to cover your costs.
Calculating your BEOR is a critical step for setting dynamic room rates and managing your capacity. In the high-stakes world of hotel operations, this number is essential for survival.
For a typical 100-room hotel with $900,000 in annual fixed costs and an average contribution margin of $90 per room, the break-even point is 10,000 room nights. This means the hotel must hit a 27.4% occupancy rate just to cover its baseline expenses.
The BEOR formula looks like this:
(Total Fixed Costs / Contribution Margin Per Room) / Total Available Room Nights Annually
Let’s walk through an example with a boutique hotel that has 50 rooms.
- Annual Fixed Costs: $750,000
- Average Daily Rate (ADR): $200
- Variable Cost Per Room: $40 (housekeeping, supplies, commissions)
- Contribution Margin Per Room: $160 ($200 - $40)
- Total Available Room Nights: 18,250 (50 rooms x 365 days)
First, we need to find the break-even point in rooms: $750,000 / $160 = 4,688 rooms.
Then, we can calculate the BEOR: (4,688 / 18,250) x 100 = 25.7%.
This hotel needs to keep over a quarter of its rooms filled every single night just to break even. That insight is huge. It helps you develop pricing strategies for the low season and forecast profitability during peak times. It also tells you exactly how much wiggle room you have on pricing before you start losing money on a booking.
If you're looking for more ways to improve your financial performance, our restaurant profit margin calculator can provide additional valuable insights.
Common Questions About Break Even Analysis
Once you start digging into break-even analysis, a few practical questions almost always come up. Answering them is what turns this from a simple formula into a tool you can actually use to make smarter decisions.
Let's walk through the questions operators ask most often and get you some straightforward answers.
How Often Should I Calculate My Break Even Point?
This is not a one-and-done calculation. You should be running the numbers quarterly at a bare minimum, but honestly, monthly is the gold standard if you want to stay agile.
Think about it: your costs are rarely static. Supplier prices creep up, you might hire a new salaried manager, or your lease gets renewed. Every single one of those changes moves the goalposts. Recalculating regularly ensures your financial targets are based on reality, not on last quarter's numbers. It helps you react quickly and adjust pricing, staffing, or purchasing before a small problem becomes a big one.
What Is a Good Contribution Margin for a Restaurant?
There’s no single magic number here, as it really depends on your concept. A quick-service spot with lower labor costs will look very different from a fine-dining restaurant.
That said, a good benchmark for most restaurants is an overall contribution margin ratio between 60% and 70%. This means for every dollar you bring in, you have 60 to 70 cents left over to cover your fixed costs (like rent and salaries) and, eventually, generate a profit.
The real power is not in the restaurant-wide number. It's in knowing the contribution margin of individual menu items. That's how you spot your winners and losers and start making smart menu engineering decisions.
How Can I Lower My Break Even Point?
Getting your break-even point down is one of the most important goals you can have. It means you get into the black faster and with fewer sales. You essentially have three levers you can pull.
- Reduce Fixed Costs: This one’s tough but has a huge impact. Can you renegotiate your lease? Shop around for better insurance rates? Audit your monthly software subscriptions and cut what you are not using? Every dollar saved here is a dollar you do not have to earn back.
- Decrease Variable Costs: This is all about efficiency. It means negotiating better pricing with your food and beverage suppliers, getting serious about reducing kitchen waste, and optimizing hourly schedules so you're not overstaffed on a slow Tuesday.
- Increase Selling Prices: Do not be afraid of this one. A small, strategic price increase on the right items goes directly to your contribution margin on every single thing you sell. It’s often the fastest way to improve your numbers.
A little bit of progress in all three areas can make a massive difference in how quickly your restaurant becomes profitable.
How Do I Calculate Break Even with Multiple Products?
This is the big one. For any restaurant or hotel, trying to calculate a break-even point in units is pretty much impossible when you have a menu full of different items at different price points.
The best way to handle this is to use the sales-dollar formula, which relies on your overall contribution margin ratio.
To get this right, you'll need to calculate a weighted-average contribution margin. This sounds complex, but it just means you figure out your sales mix—for example, what percentage of your total sales comes from food, what comes from beer, and what comes from wine. You then use that sales mix to weigh each category's contribution margin, which gives you a single, blended ratio that truly reflects how your business actually operates.
For a deeper dive on this, a dedicated Break Even Analysis Guide can walk you through the more detailed steps. Using a weighted average gives you a much more accurate revenue target to shoot for.
At MAJC, we provide hospitality leaders with the tools, community, and expert-led training to run smarter, more profitable operations. Join our community to access practical systems for everything from financial management to hiring and retention. Learn more about how MAJC can help you build a thriving business.