

On this page 25 sections
- Why You Need to Know Your Turnover Cost
- The Real Price of a Vacant Position
- A Quick Look at the Core Formula
- Turnover Cost Formula Overview
- Breaking Down the Real Cost of Turnover
- Breakdown of Employee Turnover Cost Categories
- Separation Costs
- Vacancy Costs
- Recruitment Costs
- Training Costs
- The Real Formula for Calculating Turnover Cost
- Where to Find Your Numbers
- Let's Walk Through a Real-World Example: A Restaurant Manager
- Seeing the Real Cost: A Practical Example
- First, a Few Key Numbers
- Sample Turnover Cost Calculation for a Restaurant
- The True Financial Hit
- Using Turnover Cost Data to Improve Retention
- From Numbers to Actionable Insights
- Targeting Your Retention Efforts
- Building a Business Case for Retention
- Common Questions About Turnover Costs
- How Often Should I Run This Calculation?
- Does This Change for My Part-Time Staff?
- What Is a “Good” Turnover Rate for a Restaurant, Anyway?
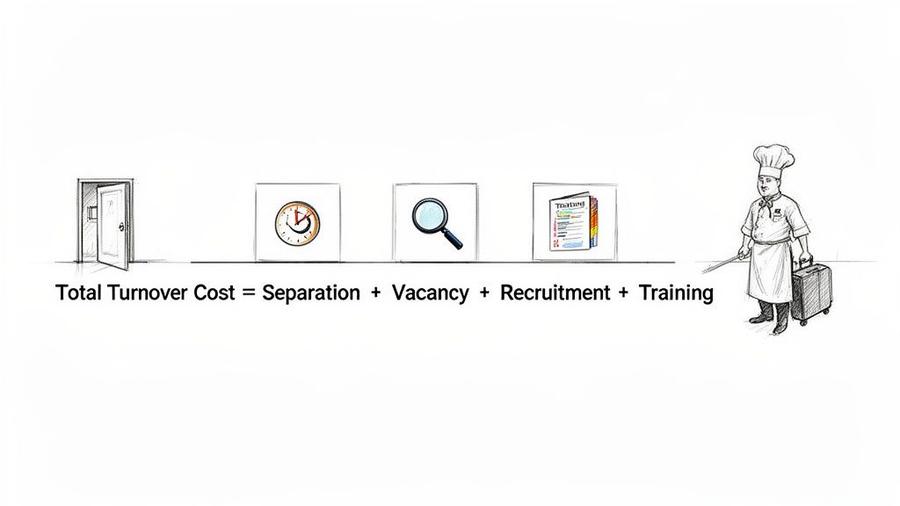
To figure out your employee turnover cost, you will add up four key expenses: separation costs + vacancy costs + recruitment costs + training costs. This simple formula captures every dollar spent from the moment an employee leaves to the point their replacement is productive.
Why You Need to Know Your Turnover Cost
Employee turnover is more than just a staffing headache; it is a silent profit killer. In the world of hospitality, every shift counts. When a key player leaves without notice, like a line cook quitting days before a holiday weekend, the impact is immediate and expensive.
You are not just losing a person. You are kicking off a chain reaction of hidden costs that go way beyond a final paycheck. Think about the time your managers spend on exit interviews, the overtime you pay other staff to cover empty shifts, the fees for posting on job boards, and every dollar poured into training a new hire. A single departure can quickly snowball into a multi-thousand-dollar problem.
The Real Price of a Vacant Position
The hospitality and food service industry is battling a staggering 75.2% total turnover rate. Experts estimate that replacing an employee costs anywhere from 50% to 200% of their annual salary.
Let that sink in. Replacing a line cook who makes $40,000 a year could cost your business between $20,000 and $80,000. You can dig into these retention statistics to see the full, eye-opening picture.
Knowing your turnover cost is not just an accounting chore. It is a critical management tool that empowers you to:
- Justify Investments: Putting a real dollar amount on the problem makes it much easier to get budget approval for better training, improved benefits, or culture initiatives that work.
- Spot Problem Areas: You can pinpoint which departments or roles are bleeding the most money, letting you focus your energy where it will have the biggest impact.
- Make Smarter Decisions: With concrete data, you can guide your hiring, onboarding, and management strategies to build a more stable and profitable team.
A Quick Look at the Core Formula
The formula itself is straightforward. The real work is in accurately identifying and adding up the costs for each component. You have to track the entire event, from the moment an employee gives notice until their replacement is performing at 100%.
Calculating your turnover cost transforms an abstract problem into a tangible number. It shifts the conversation from “we are losing too many people” to “losing a server costs us $7,500, and here is our plan to fix it.”
Here is a simple breakdown of what goes into the calculation. We will dive deeper into each of these areas, but this gives you a clear map of the road ahead.
Turnover Cost Formula Overview
This table summarizes the four main buckets of expenses you will need to track.
Component Description Separation Costs Expenses tied directly to an employee's departure, like exit interviews, administrative tasks, and final pay processing. Vacancy Costs The price of having an empty position, including lost productivity, overtime for other staff, and potential lost sales. Recruitment Costs All expenses to find and hire a replacement, from advertising the job to interviews and background checks. Training Costs The full investment required to get a new employee up to speed, including onboarding, materials, and the time of trainers and managers.
Getting a handle on these numbers is the first step toward building a more resilient and profitable operation.
Breaking Down the Real Cost of Turnover
To get a real handle on what employee turnover is costing you, you have to look beyond a single number on a spreadsheet. The true cost is a mix of dozens of smaller, often hidden expenses that bleed your bottom line dry.
The key is to break it down into four distinct buckets: separation, vacancy, recruitment, and training. Thinking about it this way turns a big, vague problem into something you can measure and manage. It is like a chef doing their mise en place. You are isolating each ingredient to understand the full recipe of your turnover problem.
Breakdown of Employee Turnover Cost Categories
Before we dive into the nitty-gritty of each category, this table gives you a quick snapshot of where the money goes. Think of it as your cheat sheet for spotting turnover costs in the wild.
Cost Category Description Hospitality Examples Separation The immediate, administrative costs incurred when an employee leaves. An HR manager’s time processing final paperwork, conducting an exit interview, and paying out unused vacation for a departing front desk agent. Vacancy The cost of lost productivity and the strain on the remaining team while a position is empty. This is often the most damaging category. Lost sales from an empty server station on a busy night, plus the overtime paid to other servers who had to cover those tables. Recruitment The direct and indirect expenses of finding, interviewing, and hiring a replacement. The cost of posting a line cook job on multiple boards, plus 20 hours of a head chef’s time spent sifting through résumés, doing phone screens, and conducting interviews. Training The investment required to get a new hire up to speed, from initial onboarding to full productivity. A new bartender's wages during their first two weeks of training, the cost of their uniform, and the senior bartender's time spent showing them the ropes instead of serving guests.
By tracking these specific examples within your own operation, you can start to see just how quickly these costs add up. Now, let’s look at each one more closely.
Separation Costs
Separation costs are the first financial hit you take the moment an employee leaves. While they might seem like the smallest piece of the puzzle, they represent time and resources that could have been spent serving guests or growing the business.
These expenses typically include:
- Administrative Time: Think about the hours your manager or HR person spends on termination paperwork, exit interviews, and processing the final paycheck, including any accrued PTO or severance.
- Benefit Continuation: Costs tied to managing benefits like COBRA for the employee who left.
- Legal Fees: In messy situations, you might need to involve a lawyer, and those fees fall right into this bucket.
For a boutique hotel, this might look like the three hours a general manager spends doing paperwork for a departing concierge. It feels small, but those are three hours of a highly paid leader's time that could have been spent coaching the team or interacting with guests.
Vacancy Costs
Once someone leaves, the clock starts ticking on vacancy costs. This is where the real damage happens. It is the silent killer of profitability because it is not just about the work that is not getting done. It is about the ripple effect it has on your entire operation.
An empty role leads directly to:
- Lost Productivity: The most obvious cost is the value of the work that person would have done. In a restaurant, an empty server station on a Saturday night is a direct hit to your sales.
- Overtime for Your Team: Your existing staff has to pick up the slack, which means burnout and bloated overtime pay. If you are not tracking this, it can completely throw off your labor cost percentage.
- Service Takes a Nosedive: An overworked, stressed-out team simply cannot deliver the kind of experience that creates regulars. This leads to bad reviews, fewer repeat visits, and a tarnished reputation.
An empty spot on the line during a dinner rush is a direct assault on your revenue. Every minute service slows down, you are losing sales. The overtime you pay the remaining cooks is a tangible vacancy cost that eats away at your margins.
Recruitment Costs
Next up are the active, out-of-pocket expenses for finding a replacement. Recruitment costs are usually the easiest to track because they involve clear invoices and payroll hours.
These are the costs of getting from a job post to a job offer:
- Advertising: Fees for job boards, social media ads, or paying a recruiter to find candidates.
- Screening and Interviewing: This is the "soft cost" of the hours your managers and senior team members spend reading résumés, doing phone screens, and holding interviews instead of running the floor.
- Background Checks: Costs for background checks, drug tests, or any other pre-employment screening you run.
Hiring a new sous chef, for example, could easily cost $500 in job board fees, 15 hours of your executive chef’s valuable time, and another $100 for a background check. Each one is a direct hit.
Training Costs
You finally made a hire. Great. But the spending does not stop there. Training costs cover everything needed to turn that new person into a productive member of your team. It is a necessary investment, but it is a huge part of the turnover equation.
Consider the money and time spent on training employees online and in-person. These costs can include:
- Onboarding and Supplies: Uniforms, handbooks, training manuals, and access to any software they will need.
- The Trainer’s Time: The hours a manager or senior employee spends training the new hire are hours they are not spending on their own high-value tasks.
- Wages During Training: You are paying the new hire from day one, but they will not be fully productive for weeks, sometimes months. Those wages are a direct training cost.
- The Inevitable Productivity Dip: New hires are slower and make more mistakes. That is natural, but it temporarily affects service speed, ticket times, and team morale.
When you add it all up, the numbers are staggering. By methodically adding up every expense in these four categories, you can finally see the true financial story behind every "Help Wanted" sign.
The Real Formula for Calculating Turnover Cost
Knowing the different parts of turnover cost is a good start, but the real power comes from putting them together into a formula you can use. The good news is the basic math is simple. The hard part is getting honest numbers for each piece of the equation.
Here is the complete formula that lays it all out:
Total Turnover Cost = Separation Costs + Vacancy Costs + Recruitment Costs + Training Costs
Think of this formula as your roadmap. It guides you from the moment an employee gives notice all the way through to when their replacement is finally up to speed and pulling their weight. To make it work, you have to become a bit of a data detective, digging through payroll reports, scheduling logs, recruitment invoices, and even supply orders to find what you need.
This flowchart breaks down those four stages, showing you exactly how one cost flows into the next.
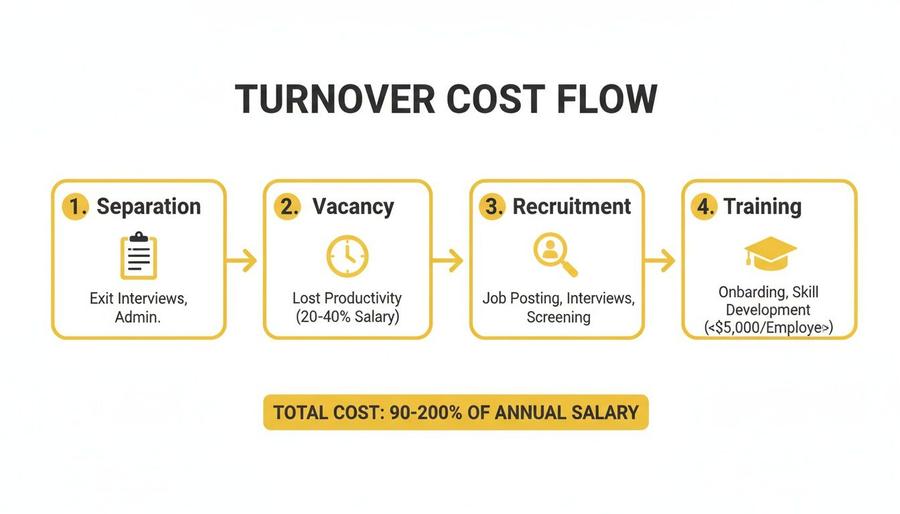
As you can see, the costs are sequential. Each stage builds on the last, creating a cumulative financial hit from losing a single employee.
Where to Find Your Numbers
Before you can plug anything into the formula, you have to gather the data. This takes some methodical work, but most of this information is already hiding in plain sight within your daily operational records.
Here is a quick guide on where to look:
- Separation Costs: Start with your payroll system. It has the final wages, accrued PTO payouts, and any severance paid. Your HR and management logs will tell you how many hours were spent on exit interviews and admin tasks.
- Vacancy Costs: This one requires a bit more digging. Your POS can help you estimate lost revenue, especially for sales-focused roles. Check payroll reports for overtime paid to other staff to cover the gap. Do not forget the soft costs. Ask your team about the impact on morale and service quality.
- Recruitment Costs: This is usually the easiest category. Just pull together all the invoices from job boards, recruiting agencies, and background check services. Then, look at manager time logs (or make a realistic estimate) to calculate the cost of their hours spent screening and interviewing.
- Training Costs: Track the new hire’s wages during their non-productive training period using your payroll software. Add in the costs of uniforms, manuals, and any certifications from your expense reports. Critically, you also need to account for the trainer's time away from their normal duties.
The goal here is not to get one perfect, down-to-the-penny number. It is to build a repeatable process that gives you a consistently reliable estimate. When you track these figures over time, you can finally spot trends and measure the actual ROI of your retention efforts.
Let's Walk Through a Real-World Example: A Restaurant Manager
Let’s see how this works in practice. Imagine a mid-level manager at your restaurant, earning $60,000 a year, decides to leave. You cannot just think about their salary; you have to trace the financial ripples their departure sends through the business. These costs often tie into other key metrics, and if you want to go deeper on how expenses connect, our guide on how to calculate prime cost is a great place to start.
Now, let's put some realistic dollar values to their exit.
1. Separation Costs
Right off the bat, you have administrative work. An HR generalist and the general manager spend a combined four hours on the exit interview, paperwork, and deactivating system access. At their blended hourly rate, that is about $200. You also pay out $1,500 in accrued vacation time.
- Total Separation Cost: $1,700
2. Vacancy Costs
The manager position stays open for six weeks. During that time, the general manager and two assistant managers have to work an extra 10 hours per week each to cover shifts and responsibilities. At their overtime rates, this adds up to $4,500. But that is not all. Without a dedicated manager overseeing service, customer complaints rise and sales dip by an estimated 3%, costing you another $3,000.
- Total Vacancy Cost: $7,500
3. Recruitment Costs
You spend $800 on premium job board postings to attract good candidates. The general manager spends 25 hours sifting through résumés, conducting interviews, and coordinating schedules. At their hourly rate, this time is worth roughly $1,000. A final round of background checks costs another $150.
- Total Recruitment Cost: $1,950
4. Training Costs
You hire a new manager. Their first three weeks are all about onboarding and training, meaning they are not fully productive yet. Their salary for this period is $3,460. The general manager also invests 40 hours directly into their training, a time cost of $1,600. Add another $200 for new uniforms and training manuals.
- Total Training Cost: $5,260
Finally, we just add it all up:
$1,700 (Separation) + $7,500 (Vacancy) + $1,950 (Recruitment) + $5,260 (Training) = $16,410
The departure of just one mid-level manager cost the business over $16,000. That is more than 27% of their annual salary. This is the kind of hard data that shifts turnover from being an HR headache to a critical business priority.
To make this even easier, we have put together a downloadable spreadsheet. Just plug in your own numbers for each category, and it will automatically calculate your total turnover cost, giving you the clarity you need to make smarter retention decisions.
Seeing the Real Cost: A Practical Example
Formulas and theories are one thing, but the numbers do not really hit home until you plug them into a real-world scenario. Let's walk through a practical example to show you exactly how these costs stack up in a typical restaurant.
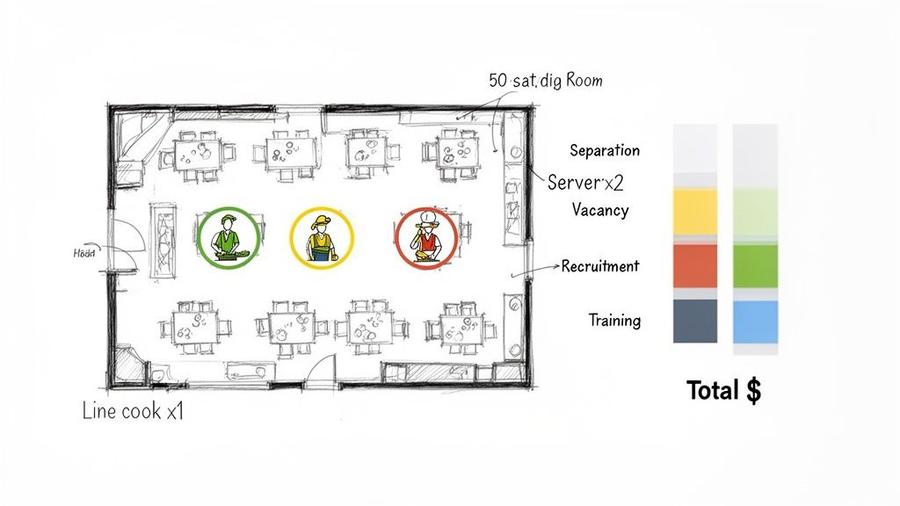
Imagine you run "The Corner Bistro," a bustling 50-seat spot. Last quarter was tough. You lost three key team members: two servers who found jobs closer to home, and a solid line cook who was just burnt out.
Now, let's break down what that actually cost the business, line by line.
First, a Few Key Numbers
To get started, we need a few baseline figures for The Corner Bistro.
- Line Cook Annual Salary: $45,000 ($21.63/hour)
- Server Average Annual Earnings (with tips): $38,000 ($18.27/hour)
- Restaurant Manager's Hourly Rate: $30/hour
- Head Chef's Hourly Rate: $35/hour
With these numbers in hand, we can start adding up the real costs for each of those three empty positions.
Sample Turnover Cost Calculation for a Restaurant
Let's focus on just one person first: the line cook who left. The table below gives you a detailed look at how quickly the expenses add up for just a single departure. It is often more than operators think.
Cost Item Calculation/Notes Estimated Cost Separation Costs Manager's Time (Exit Interview) 1.5 hours of the manager's time for the exit interview and final paperwork. (1.5 hours x $30/hour) $45 Accrued PTO Payout The cook had 20 hours of unused paid time off. (20 hours x $21.63/hour) $433 Vacancy Costs Overtime for Other Cooks The remaining kitchen staff worked an extra five hours of OT per week for four weeks. (20 hours x $32.45 OT rate) $649 Head Chef Covering Shifts The Head Chef had to work the line for an extra 10 hours per week for four weeks. (40 hours x $35/hour) $1,400 Lost Productivity and Errors Estimated cost of slower ticket times, food waste from errors, and kitchen disorganization. $750 Recruitment Costs Job Board Advertisements Cost for premium listings on two industry-specific job boards for one month. $400 Manager and Chef Interview Time The Head Chef spent 10 hours screening and interviewing; the manager spent four hours. (10x$35 + 4x$30) $470 Background Check Standard pre-employment screening for the final candidate. $50 Training Costs New Hire Wages (Training Period) The new cook's wages for their first 80 hours of training before they are fully productive. (80 hours x $21.63/hour) $1,730 Trainer's Time (Head Chef) Head Chef’s time dedicated to hands-on training for the first two weeks. (30 hours x $35/hour) $1,050 Uniforms and Supplies Cost for two sets of chef coats, pants, and non-slip shoes. $250 Total Cost for One Line Cook Sum of all the costs above. $7,227
As you can see, the little things become big things very quickly.
The True Financial Hit
Just replacing that one line cook cost The Corner Bistro over $7,200. That is a staggering 16% of the cook's annual salary gone in a flash. When you are operating on thin margins, that kind of number is a wake-up call. To see how these costs fit into the bigger financial picture, check out our guide to industry ratios for restaurants.
Now, what about the two servers? Their turnover cost is usually a bit lower thanks to a smaller salary and less intensive one-on-one training, but it is far from zero.
The biggest mistake operators make is ignoring the "soft costs" of a vacancy. The overtime pay is easy to see on a P&L, but the real damage comes from the strain on your remaining team, the dip in service quality, and the customer frustration that follows. These are real financial drains that have to be part of the equation.
Let’s estimate the combined cost for both servers was $9,000 (or $4,500 each). That number covers the manager’s time sifting through resumes, the wages paid during training, and the inevitable lost sales from having less experienced staff on the floor.
So, when you add it all up for the quarter:
- Line Cook: $7,227
- Two Servers: $9,000
- Total Quarterly Turnover Cost: $16,227
Losing just three people in three months cost the business over $16,000. If that pattern continues, you are looking at more than $64,000 walking out the door every year. That is money that could have gone toward new equipment, marketing, or bonuses for the people who stick around.
This simple exercise makes one thing crystal clear: knowing your turnover cost is not just an accounting task. It is the first and most critical step toward stopping the bleed and building a team that stays.
Using Turnover Cost Data to Improve Retention
Calculating your employee turnover cost does more than just spit out a startling number; it hands you a powerful tool for change. Once you have this data, you can finally shift from reacting to turnover to proactively preventing it. The figures you have calculated are the foundation for building a rock-solid business case for investing in your people.
This data is how abstract ideas like "improving company culture" or "better onboarding" become tangible financial goals. It lets you walk into a leadership meeting and say, "Our high turnover in the kitchen is costing us over $7,000 for every line cook who leaves. A $5,000 investment in a new training program could realistically cut that cost in half within a year." Suddenly, retention is not just a fuzzy HR initiative; it is a strategic move with a clear, undeniable return on investment.
From Numbers to Actionable Insights
Your turnover cost calculation is a starting point, not the finish line. To make it truly useful, you need to track it over time. A single number gives you a snapshot, but tracking it quarterly is what reveals the trends, patterns, and the real impact of your retention efforts.
Your first calculation is your baseline. That is your starting line. From there, the goal is simple: make that number smaller every quarter. This continuous measurement is what allows you to finally connect specific actions to real financial outcomes.
Do not just calculate your turnover cost once and file it away. Treat it like any other key performance indicator, like your food cost or RevPAR. Review it regularly, discuss it with your leadership team, and use it to hold yourselves accountable for creating a better place to work.
Once you truly understand your costs, the next move is to implement effective strategies on how to reduce employee turnover. When you can tie every retention measure back to specific cost savings, you build a case for change that is impossible to ignore.
Targeting Your Retention Efforts
With your data in hand, you can stop guessing and start targeting the actual root causes of turnover. Different cost categories point to different problems. By analyzing where the money is going, you can choose the right solutions to fix the leaks.
Here is how to connect your cost data to specific retention strategies:
- High Separation Costs: Are administrative time and exit interview hours piling up? This might point to a disorganized, clunky offboarding process. Streamlining this can free up a ton of valuable manager time.
- High Vacancy Costs: Is overtime pay your biggest drain? Are you seeing lost sales? This is a huge red flag that vacant roles are putting immense strain on your remaining team. It highlights an urgent need for better cross-training and a deeper bench of talent to fill gaps quickly.
- High Recruitment Costs: If you are spending a fortune on job ads and countless interview hours, your hiring process might be broken or inefficient. Investing in a better applicant tracking system or refining your interview questions can bring this cost way down.
- High Training Costs: When training expenses are out of control, it often means your onboarding is not sticking. New hires might be taking too long to become productive or leaving shortly after you have invested all that time and money into training them.
For a deeper dive into building a team that wants to stay, our guide on how to improve employee retention offers practical strategies you can implement right away.
Building a Business Case for Retention
Armed with specific numbers, you can approach your leadership team or investors with a clear, data-driven plan. Instead of making emotional appeals about employee happiness, you can present a financial argument they simply cannot ignore.
Frame your proposals around cost reduction. For example:
- Proposal: Implement a peer mentoring program for new hires.
- The Business Case: "Our training costs are $2,500 per new server, and we know that 30% of them leave within their first 90 days. By investing $500 per person in a solid mentorship program, we can improve new-hire support, slash that early turnover rate, and save an estimated $15,000 this year alone."
- Proposal: Invest in leadership training for department managers.
- The Business Case: "Our exit interviews consistently show that a lack of support from management is a top reason people are leaving. By spending $10,000 on leadership development, we project we can reduce our overall turnover by 10%, saving the company over $25,000 in associated costs."
This approach turns your turnover cost calculation from a historical report into a forward-looking tool for growth. It empowers you to build a more stable, engaged, and profitable team one data point at a time.
Common Questions About Turnover Costs
Once you start digging into the numbers, a few questions always come up. Here are the most common ones I hear from operators and some straight answers based on experience.
How Often Should I Run This Calculation?
Do it quarterly. Anything less frequent, and you are flying blind.
A quarterly check-in is the sweet spot. It is frequent enough to spot trends before they become disasters, but not so often that it feels like a massive administrative chore. It lets you see if that new retention bonus is working, helps you anticipate seasonal staffing dips, and flags a problem in a specific department before it bleeds cash for a whole year.
If quarterly feels like too much right now, you must do a full calculation once a year. Use it to build your annual budget and set your strategic goals for the coming year.
Does This Change for My Part-Time Staff?
The formula stays the same, but the final number will almost always be lower for part-time employees. It just makes sense. Costs tied to salary, like separation pay, and the value of lost productivity are naturally smaller for part-time roles.
But do not make the mistake of ignoring part-time turnover. High churn, even in these roles, adds up. It creates a constant drag on your resources and, more importantly, can destabilize the consistency of your service. A revolving door is a revolving door.
What Is a “Good” Turnover Rate for a Restaurant, Anyway?
The honest answer? A "good" rate is any number that is consistently getting smaller for your business. The industry average is a staggering 75%, so fixating on a single magic number is a losing game.
Instead, focus on continuous improvement. A well-run independent spot might fight to get its rate below 50%. A top-tier restaurant group with a powerful culture and great benefits might even get down into the 30% range.
The key is to benchmark against yourself. Use your own past performance as the standard and use this cost calculation to justify the investments you need to make to drive that number down, year after year.
Ready to stop the financial drain of turnover and build a team that stays? MAJC provides the tools, community, and expert-led training designed for hospitality operators. From smarter hiring to effective retention strategies, we help you build a more profitable and sustainable business. Start running a smarter restaurant today.