

On this page 26 sections
- Decoding Cost of Goods Sold
- What Counts as COGS in a Restaurant
- The Essential COGS Formula and How to Calculate It
- Breaking Down the COGS Formula
- Why This Calculation Is So Important
- How Inventory Accounting Methods Impact Your COGS
- First-In, First-Out (FIFO)
- Last-In, First-Out (LIFO)
- Weighted Average Cost
- A Practical Restaurant Example of COGS in Action
- Setting the Scene at The Corner Bistro
- How Accounting Methods Change the Numbers
- Comparing FIFO and LIFO Results
- From COGS to Gross Profit
- Uncovering Your Key Performance Indicators
- Putting It All Together With Prime Cost
- COGS vs Other Key Financial Metrics
- Practical Strategies to Control and Reduce Your COGS
- Optimize Your Sourcing and Vendor Relationships
- Master Your Inventory Management
- Engineer Your Menu for Profitability
- Your Top COGS Questions, Answered
- What’s the Ideal COGS Percentage for a Restaurant?
- How Often Should I Be Calculating COGS?
- Can Labor Costs Ever Be Part of COGS?
- What’s the Difference Between COGS and Operating Expenses?
Let's get straight to it: Cost of Goods Sold (COGS) is the total direct cost of everything you sold over a certain period. Think of it as the wholesale price of the menu items that actually left your kitchen and went to a customer.
This number includes the raw ingredients, the beverages, and anything else that ends up on the plate or in the glass. It is a core metric for any operator who wants to understand their restaurant’s real financial health.
Decoding Cost of Goods Sold
Think of COGS as the story of your inventory in motion. It is a critical line item on your income statement that tells you exactly how much you spent on the products that were actually purchased by guests. Nailing this number down is the first step to truly understanding your profitability.
Without a solid handle on your COGS, you are flying blind. You will not know if your menu is priced for profit, if your purchasing is efficient, or where money might be quietly leaking from your operations.
What Counts as COGS in a Restaurant
For a restaurant, hotel, or bar, figuring out COGS should be straightforward. It is all about the direct costs tied to the food and drinks you sell. This is not the place for your marketing budget or your manager's salary. Instead, it is a laser-focused look at the tangible goods your customers consume.
To make it crystal clear, here’s a quick breakdown of what goes into your COGS calculation and what stays out.
Getting this distinction right is what makes COGS such a powerful tool. It gives you a clean, honest look at your menu's profitability before all the other operational costs muddy the waters. Calculating COGS accurately is a strategic necessity that directly impacts your gross profit—the money left over to cover everything else, from rent and utilities to payroll.
It is also crucial to distinguish COGS from other key metrics that include different expenses. For instance, Prime Cost combines COGS with your total labor costs. To see how that works, you can learn more about https://majc.ai/post/how-to-calculate-prime-cost/ in our detailed guide.
Excluding those operational expenses from your COGS calculation is essential for an accurate picture of your business. This focused approach is what makes the metric so valuable for operators trying to make smarter decisions about purchasing, pricing, and menu engineering.
For another perspective, check out this excellent resource that breaks down the fundamentals: What Is Cost of Goods Sold (COGS)? A Simple Guide. It is a great way to reinforce exactly how to categorize every expense for a precise financial snapshot.
The Essential COGS Formula and How to Calculate It
Knowing what COGS is gets you in the game. Knowing how to calculate it is how you win.
The standard COGS formula is the engine behind your P&L, and thankfully, it is not complicated. At its heart, it just tracks the value of inventory as it moves through your business during a set period—say, a month or a quarter.
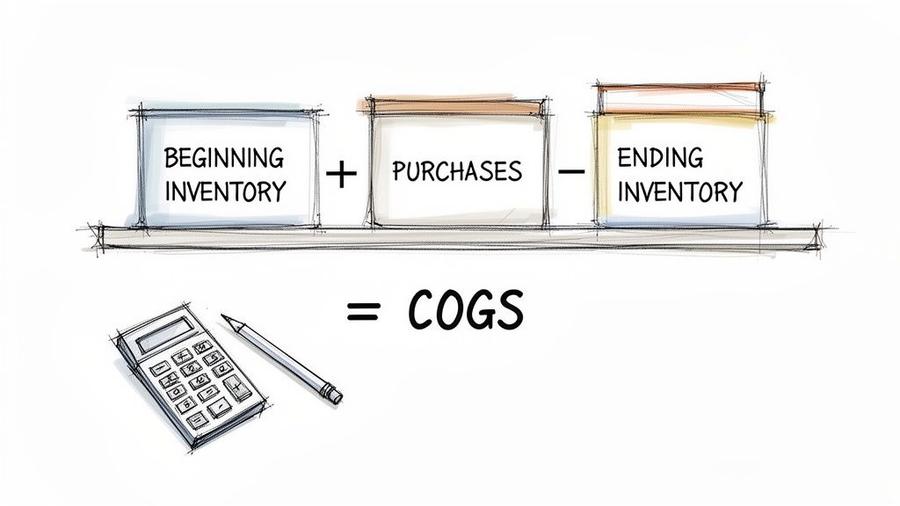
The formula is: Beginning Inventory + Purchases – Ending Inventory = COGS.
Think of it like running your home pantry for the month. Simple, right? Let's break down what each piece really means for your restaurant.
Breaking Down the COGS Formula
Each part of this equation tells a piece of your inventory's story. Getting these numbers right is non-negotiable, because small mistakes here can throw off your entire financial picture and lead to some seriously bad business calls.
- Beginning Inventory: This is the dollar value of every single food and beverage item you had sitting on your shelves at the very start of the accounting period (like the morning of January 1). In our pantry analogy, this is all the flour, wine, and olive oil you already own.
- Purchases: This is the cost of all the new inventory you bought during that same period. It is every invoice for produce, meat, liquor, and to-go boxes. This is where sharp record-keeping becomes critical; learning how to effectively organize receipts is a foundational skill for managing your expenses.
- Ending Inventory: Finally, this is the value of all the inventory you have left at the very end of the period (say, the last night of January). This number requires a real, physical count of everything still on your shelves. No shortcuts here.
Once you have these three figures, the math is easy. You add what you started with to everything you bought, then subtract whatever was left over. What remains is the value of all the inventory that was sold, used, or otherwise disappeared from your stock.
That number is your Cost of Goods Sold.
Why This Calculation Is So Important
This formula does a lot more than spit out a number for your income statement. It gives you a clear, honest look at your operational efficiency.
It is also the first domino you need to knock over to calculate other critical metrics. For example, you cannot get a true read on your food cost percentage without a rock-solid COGS figure.
Just how much do these direct costs matter? A lot. Subtracting your COGS from your total revenue gives you your gross profit. This is the foundational profit you have left over to pay for everything else—labor, rent, utilities, you name it. A healthy gross profit is the first sign of a business that is built to last.
How Inventory Accounting Methods Impact Your COGS
Calculating your Cost of Goods Sold is not as simple as just subtracting a few numbers. The way you value the inventory sitting on your shelves can dramatically change your final COGS figure, which in turn messes with your reported profit.
Think about it: If the price you pay for a case of avocados changes three times this month, which cost do you use when you sell a bowl of guacamole? That is where inventory accounting methods come in. These are just the rules you follow to assign a dollar value to your inventory, and picking the right one is a serious strategic decision.
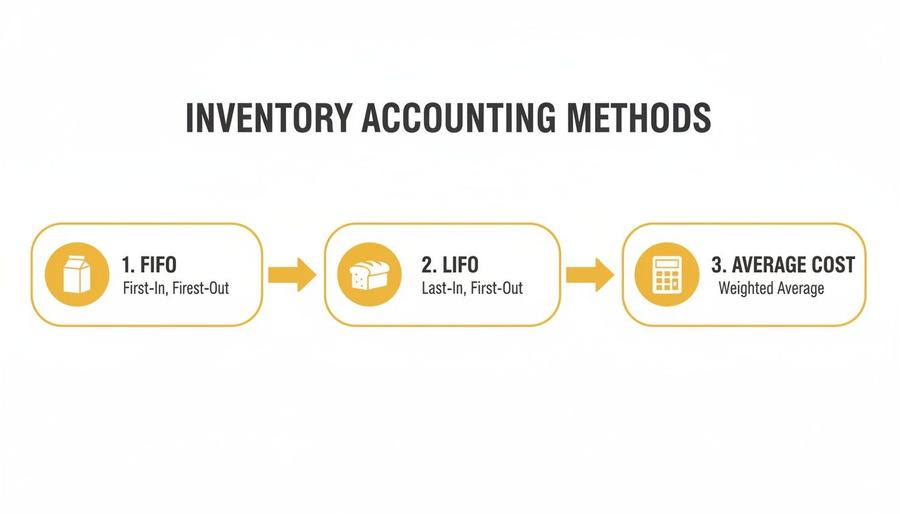
Let’s break down the three main methods you will see in the hospitality world.
First-In, First-Out (FIFO)
The First-In, First-Out (FIFO) method is exactly what it sounds like and is the most common-sense approach for restaurants. It assumes that the first items you buy are the first ones you use.
Picture your walk-in cooler. When a new milk delivery arrives, you instinctively rotate the old cartons to the front so they get used before they expire. FIFO is just the accounting version of that. You expense the cost of your oldest inventory first.
This becomes a big deal when prices are rising. By expensing your older, cheaper inventory first, your COGS stays lower. That makes your gross profit look higher on paper, but it also means you will have a higher tax bill. FIFO presents a healthier financial picture, but you will pay for it in taxes.
Last-In, First-Out (LIFO)
On the flip side, the Last-In, First-Out (LIFO) method assumes the exact opposite. It works on the idea that the newest items you bought are the first ones to be sold.
Imagine a stack of flour sacks in a tight dry storage room. It is just easier to grab the new bag off the top than to dig for the one at the very bottom. LIFO assigns the cost of that newest, most recently purchased bag to the sale.
When your costs are going up, LIFO has a very different effect on your books. You are expensing your newest, most expensive inventory first, which drives your COGS up. This reduces your reported gross profit and, as a result, lowers your taxable income. While that tax advantage is nice, it is crucial to know that LIFO is not allowed under International Financial Reporting Standards (IFRS), though it is permitted in the U.S. under GAAP. The choice between FIFO and LIFO is a strategic decision that directly impacts your tax bill and how investors or lenders perceive your profitability.
Weighted Average Cost
The Weighted Average Cost (WAC) method is the middle ground. It smooths out all those price jumps by using a simple average. Instead of tracking the cost of every single purchase, you calculate one average cost for all the identical items you have in stock.
You find this number by dividing the total cost of everything you have on hand by the total number of units.
- Total Cost of Goods ÷ Total Units in Stock = Weighted Average Cost per Unit
You then use this single average cost to value both your COGS and your ending inventory. It gives you a more stable, less volatile snapshot of your costs over time. This method is a lifesaver for items that get co-mingled, like bins of sugar or flour, where tracking individual purchase prices is next to impossible.
A good food inventory management system can automate these calculations, making any of these methods far less of a headache. The real key is consistency—once you pick a method, you need to stick with it to keep your financial reporting reliable.
A Practical Restaurant Example of COGS in Action
Theory is great, but let's see how this stuff actually works on the ground. We will walk through the numbers for a fictional spot, 'The Corner Bistro,' to see how COGS plays out during a typical month.
Watching their numbers makes the abstract ideas tangible. You will see exactly how a few key decisions can change the story your P&L tells.
Setting the Scene at The Corner Bistro
The Corner Bistro kicks off April with a well-stocked pantry. After a full count on the last night of March, the team pegs their beginning inventory at $20,000.
Throughout the month, business is steady. Chefs are ordering produce, meat, and dry goods, while the bar manager keeps the wine and spirits flowing. All told, the bistro’s total purchases for April come to $15,000.
On April 30, the team does it all again, counting every last bottle and box. This time, their ending inventory lands at $18,000.
With those three numbers, we have everything we need to calculate The Corner Bistro’s COGS for April.
Beginning Inventory ($20,000) + Purchases ($15,000) – Ending Inventory ($18,000) = $17,000
The bistro’s COGS for the month was $17,000. That is the direct cost of the ingredients and drinks that became sales.
How Accounting Methods Change the Numbers
Now for the interesting part. Let's say The Corner Bistro bought ground beef three times in April, but the price went up with each purchase.
- Purchase 1 (April 5): 100 pounds at $4.00/lb = $400
- Purchase 2 (April 15): 100 pounds at $4.50/lb = $450
- Purchase 3 (April 25): 100 pounds at $5.00/lb = $500
Over the month, the kitchen used 220 pounds of ground beef. The million-dollar question is: Which cost do you assign to those sales? The answer depends entirely on your inventory accounting method.
This choice creates a fork in the road, leading to different financial outcomes.
Each method gives you a different way to value the inventory you sold, which directly impacts your final COGS calculation.
Comparing FIFO and LIFO Results
Let's see how the bistro’s ground beef COGS changes depending on the accounting method they pick.
1. Using the FIFO Method (First-In, First-Out)
With FIFO, you assume the oldest beef gets used first. It is the most intuitive approach for a kitchen. To account for the 220 pounds sold, you would expense the inventory in the order it came in.
- 100 lbs from Purchase 1 @ $4.00/lb = $400
- 100 lbs from Purchase 2 @ $4.50/lb = $450
- 20 lbs from Purchase 3 @ $5.00/lb = $100
The FIFO COGS for the ground beef comes out to $950 ($400 + $450 + $100).
2. Using the LIFO Method (Last-In, First-Out)
With LIFO, you assume the newest product gets used first. This flips the calculation on its head, expensing the most recent—and in this case, most expensive—purchases first.
- 100 lbs from Purchase 3 @ $5.00/lb = $500
- 100 lbs from Purchase 2 @ $4.50/lb = $450
- 20 lbs from Purchase 1 @ $4.00/lb = $80
The LIFO COGS for the exact same ground beef would be $1,030 ($500 + $450 + $80).
Just like that, a simple accounting choice creates an $80 difference in COGS for a single ingredient. Now, imagine that effect across your entire inventory. In a rising-price environment like this one, LIFO gives you a higher COGS, which means lower reported profit and a smaller tax bill. FIFO does the opposite, making your profit look healthier on paper but potentially increasing what you owe in taxes.
Figuring out your Cost of Goods Sold is a huge first step, but its real power comes from what you do with that number. COGS is not just a figure for your accountant; it is the foundation for the key performance indicators (KPIs) that tell you the real story of your restaurant's financial health.
When you connect COGS to other metrics, you stop just calculating costs and start managing them strategically. This is how you begin making smarter, data-driven decisions about your menu, pricing, and day-to-day operations.
From COGS to Gross Profit
The first and most direct link to make is between COGS and your Gross Profit. Think of this as the money you have left over from sales after paying for the actual food and drinks you sold. It is the starting point for your profitability.
The math is simple:
Total Revenue – Cost of Goods Sold = Gross Profit
Gross Profit tells you if your core business model is even working. It is the pool of money you have to cover everything else—labor, rent, marketing, you name it. A healthy gross profit is the first sign of a sustainable restaurant.
Uncovering Your Key Performance Indicators
With your COGS and Gross Profit numbers in hand, you can now calculate other essential restaurant metrics. Turning these numbers into percentages gives you a standardized way to measure your efficiency and track your performance over time.
- Gross Profit Margin Percentage: This shows what percentage of revenue is left after accounting for COGS. Just divide your Gross Profit by your Total Revenue. A higher margin means you are doing a better job of turning sales into actual profit.
- Food Cost Percentage: This is a laser-focused look at the cost of your food ingredients relative to your food sales. It is a make-or-break KPI for controlling kitchen costs and is calculated by dividing your food COGS by your food revenue.
For instance, if your restaurant’s success depends on a strong food and beverage program, keeping these costs in check is everything. In the hotel F&B world, COGS makes up 24.0% of total department expenses, second only to labor. A recent hotel industry analysis showed that even with rising costs, operators who managed their COGS effectively actually saw their profit margins grow. It is proof that tight cost control directly fuels your bottom line.
Putting It All Together With Prime Cost
While COGS covers your inventory, it is only one piece of the profitability puzzle. The other massive variable expense is always labor. When you combine your COGS with your total labor costs, you get your Prime Cost.
Cost of Goods Sold + Total Labor Costs = Prime Cost
Prime Cost gives you the clearest picture of your controllable expenses. It is usually the biggest slice of a restaurant's budget, often landing between 55% and 65% of total sales. Keeping a close eye on your Prime Cost is absolutely essential for maintaining healthy margins.
These KPIs are more than just numbers on a spreadsheet. They are diagnostic tools. They help you answer the tough questions: Is that new menu item priced right? Are we buying ingredients efficiently? Are our labor costs getting out of line with our sales?
Understanding COGS and how it connects to these other metrics gives you the clarity to build a more resilient and profitable operation. And if you need to get a handle on the rest of your expenses, check out our guide on calculating your overhead rate.
To help you keep these terms straight, we have broken them down in a simple table. It is easy to get them confused, but each one tells a very different part of your financial story.
COGS vs Other Key Financial Metrics
Think of it this way: COGS tells you what your ingredients cost. Gross Profit tells you what is left after paying for those ingredients. And Prime Cost tells you what is left after paying for both your ingredients and your people. Each one gives you a different lens to look at the health of your business.
Practical Strategies to Control and Reduce Your COGS
Knowing your cost of goods sold is one thing. Actually controlling it is how you build a restaurant that lasts.
Mastering COGS is not about buying cheaper ingredients or cutting corners on quality. It is about putting smarter, more efficient systems in place that protect your margins, shift after shift. The goal is to turn numbers on a spreadsheet into real-world actions that strengthen your bottom line.
Let's walk through some of the most effective strategies for getting your COGS dialed in.
Optimize Your Sourcing and Vendor Relationships
Every dollar you spend starts with your suppliers, which makes your supply chain the first and best place to look for savings. Strong vendor relationships and smart sourcing are not just nice to have; they are fundamental to controlling your cost of goods sold.
Start by auditing your suppliers on a regular basis. Are you still getting the best price for the quality you need? Do not be afraid to negotiate, ask about discounts for paying early, or see if new vendors can offer better terms. A true partnership with your purveyors can unlock better deals and give you more flexibility when things get tight.
As this global hospitality market report shows, strategic supply chain moves are one of the most powerful levers you can pull to manage costs effectively.
Master Your Inventory Management
Every single item sitting on your shelves is cash that is not in your bank account. The longer it sits there, the greater the risk of spoilage, waste, or theft—all of which drive your COGS straight up. For a healthy restaurant, tight inventory control is non-negotiable.
Get a strict "first-in, first-out" (FIFO) system running in your walk-in and dry storage. It is simple, but it ensures older products get used before they expire. You also need to be doing regular inventory counts. I recommend weekly for your high-cost items and monthly for everything else. This helps you spot problems early and keeps your COGS formula deadly accurate. An organized storeroom and walk-in are signs of an organized business. When your inventory is managed with precision, you reduce waste, deter theft, and gain a much clearer picture of your true costs.
Engineer Your Menu for Profitability
Your menu is more than a list of dishes. It is your most important sales tool. Menu engineering is the process of analyzing and designing your menu to subtly guide guests toward your most profitable items.
It starts with calculating the exact COGS and profit margin for every dish you sell. Once you have those numbers, you can sort every item into one of four categories: stars, puzzles, plowhorses, and dogs.
- Stars: High profit, high popularity. These are your winners. Feature them prominently.
- Puzzles: High profit, but nobody is ordering them. Try a more appealing description, a better photo, or have your servers recommend them.
- Plowhorses: Super popular, but the margin is thin. Can you raise the price by a dollar? Or can you tweak the recipe to lower its cost without sacrificing quality?
- Dogs: Low profit and low popularity. These are just taking up space. It is probably time to 86 them for good.
By strategically positioning your high-margin dishes and rethinking your low-margin ones, you can seriously boost your overall profitability without making any drastic changes. This is not a one-and-done task; it is a continuous cycle of analysis and adjustment that keeps your COGS in check and your business thriving.
Your Top COGS Questions, Answered
Even after you have got the formula down, it is normal to have a few lingering questions about how COGS actually works day-to-day. Let’s tackle some of the most common ones we hear from operators.
Think of this as your quick-reference guide to sharpen your understanding and put these numbers to work.
What’s the Ideal COGS Percentage for a Restaurant?
This is the million-dollar question, but the honest answer is: there is no single magic number. The "right" COGS percentage depends entirely on your concept. A fine-dining steakhouse will naturally have a much higher COGS than a coffee shop or a pizzeria. It is all relative.
That said, a solid benchmark for many full-service restaurants is somewhere between 28% and 35% of total revenue. For quick-service or fast-casual spots, the target is often a bit tighter, landing closer to 25% to 30%.
The most important thing is not hitting some industry-wide average. It is about setting a target that makes sense for your specific business model and then tracking your performance against it religiously.
How Often Should I Be Calculating COGS?
If you are only calculating COGS once a year for your accountant, you are flying blind. To get real, actionable insights that can actually save you money, you need to measure it on a regular, consistent rhythm.
- Monthly: This is the bare minimum. Calculating COGS every month lines up perfectly with your monthly Profit and Loss (P&L) statement, giving you a clear, big-picture view of your performance.
- Weekly: This is where the real operators live. For restaurants with high volume or tight margins, a weekly calculation is a game-changer. It allows you to spot and fix problems with waste, theft, or purchasing way faster—before they have a chance to do serious damage to your bottom line.
Can Labor Costs Ever Be Part of COGS?
This is a great question, and the short answer is generally, no. The standard definition of COGS for a restaurant or hotel only includes the direct costs of the products you sold—your food and beverage ingredients.
All your other labor costs, like salaries for servers, managers, and most of your line cooks, fall under operating expenses.
There is a rare exception for what’s called direct production labor. For instance, if you have a baker on staff whose only job is to produce the bread you sell, you could argue their wages are part of COGS. But for the sake of simplicity and consistency, almost every operator keeps all labor costs separate and analyzes them as part of their Prime Cost instead.
What’s the Difference Between COGS and Operating Expenses?
Getting this distinction right is critical. Cost of Goods Sold (COGS) is the direct cost of the actual inventory you sold. It is the flour in the pizza dough and the tequila in the margarita. You only incur these costs when you make a sale.
Operating Expenses (OpEx) are all the other costs you have to pay just to keep the lights on and run the business, whether you sell anything or not. This includes things like rent, utilities, marketing, server payroll, and software subscriptions.
Here is an easy way to think about it: You have to pay your rent (an operating expense) even if you sell zero dishes. But you only pay for the cost of a steak (COGS) when a customer actually orders one.
Ready to build a smarter, more profitable hospitality business? At MAJC, we provide operators with the community, training, and tools to master their finances, lead their teams, and grow with confidence. Join our community today to access expert-led workshops, proven templates, and a network of peers dedicated to helping you succeed.